|
|
| Line 8: |
Line 8: |
| | | | |
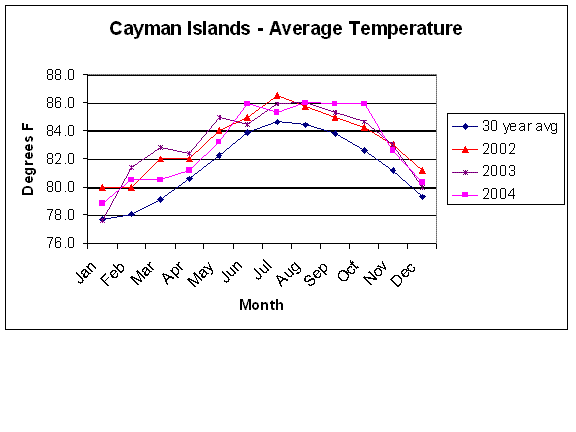
| | {| border="1" cellpadding="5" cellspacing="0" align="center" | | {| border="1" cellpadding="5" cellspacing="0" align="center" |
| - | |+'''Temperature''' | + | | '''Temperature''' |
| | |- | | |- |
| | ! | Month | | ! | Month |
| - | ! | Average<br>30-year<br>temp (°F) | + | ! | Average<br>30-year<br>temp ( |
| - | ! | Average<br>30-year<br>temp (°C)
| + | |
| - | ! | Average<br>2002<br>temp (°F)
| + | |
| - | ! | Average<br>2002<br>temp (°C)
| + | |
| - | ! | Average<br>2003<br>temp (°F)
| + | |
| - | ! | Average<br>2003<br>temp (°C)
| + | |
| - | ! | Average<br>2004<br>temp (°F)
| + | |
| - | ! | Average<br>2004<br>temp (°C)
| + | |
| - | ! | Average<br>hours of<br>sunshine
| + | |
| - | | + | |
| - | |-
| + | |
| - | | January
| + | |
| - | | 77.6
| + | |
| - | | 25.3
| + | |
| - | | 80.0
| + | |
| - | | 26.7
| + | |
| - | | 77.6
| + | |
| - | | 25.3
| + | |
| - | | 78.8
| + | |
| - | | 16.0
| + | |
| - | | 8
| + | |
| - | | + | |
| - | |-
| + | |
| - | | February
| + | |
| - | | 78.0
| + | |
| - | | 25.6
| + | |
| - | | 80.0
| + | |
| - | | 26.7
| + | |
| - | | 81.4
| + | |
| - | | 27.4
| + | |
| - | | 80.5
| + | |
| - | | 26.9
| + | |
| - | | 9
| + | |
| - | | + | |
| - | |-
| + | |
| - | | March
| + | |
| - | | 79.1
| + | |
| - | | 26.2
| + | |
| - | | 82.0
| + | |
| - | | 27.8
| + | |
| - | | 82.8
| + | |
| - | | 28.2
| + | |
| - | | 80.5
| + | |
| - | | 26.9
| + | |
| - | | 9
| + | |
| - | | + | |
| - | |-
| + | |
| - | | April
| + | |
| - | | 80.5
| + | |
| - | | 26.9
| + | |
| - | | 82.0
| + | |
| - | | 27.8
| + | |
| - | | 82.4
| + | |
| - | | 28.0
| + | |
| - | | 81.2
| + | |
| - | | 27.3
| + | |
| - | | 10
| + | |
| - | | + | |
| - | |-
| + | |
| - | | May
| + | |
| - | | 82.3
| + | |
| - | | 27.9
| + | |
| - | | 84.0
| + | |
| - | | 28.9
| + | |
| - | | 85.0
| + | |
| - | | 29.4
| + | |
| - | | 83.2
| + | |
| - | | 28.4
| + | |
| - | | 9
| + | |
| - | | + | |
| - | |-
| + | |
| - | | June
| + | |
| - | | 83.9
| + | |
| - | | 28.8
| + | |
| - | | 85.0
| + | |
| - | | 29.4
| + | |
| - | | 84.4
| + | |
| - | | 29.1
| + | |
| - | | 85.9
| + | |
| - | | 29.9
| + | |
| - | | 8
| + | |
| - | | + | |
| - | |-
| + | |
| - | | July
| + | |
| - | | 84.6
| + | |
| - | | 29.2
| + | |
| - | | 86.5
| + | |
| - | | 30.3
| + | |
| - | | 85.9
| + | |
| - | | 29.9
| + | |
| - | | 85.3
| + | |
| - | | 29.6
| + | |
| - | | 9
| + | |
| - | | + | |
| - | |-
| + | |
| - | | August
| + | |
| - | | 84.4
| + | |
| - | | 29.1
| + | |
| - | | 85.7
| + | |
| - | | 29.8
| + | |
| - | | 86.0
| + | |
| - | | 30.0
| + | |
| - | | 86.0
| + | |
| - | | 30.0
| + | |
| - | | 8
| + | |
| - | | + | |
| - | |-
| + | |
| - | | September
| + | |
| - | | 83.8
| + | |
| - | | 28.8
| + | |
| - | | 85.0
| + | |
| - | | 29.4
| + | |
| - | | 85.3
| + | |
| - | | 29.6
| + | |
| - | | 85.9
| + | |
| - | | 29.9
| + | |
| - | | 8
| + | |
| - | | + | |
| - | |-
| + | |
| - | | October
| + | |
| - | | 82.5
| + | |
| - | | 28.1
| + | |
| - | | 84.2
| + | |
| - | | 29.0
| + | |
| - | | 84.6
| + | |
| - | | 29.2
| + | |
| - | | 85.9
| + | |
| - | | 29.9
| + | |
| - | | 7
| + | |
| - |
| + | |
| - | |-
| + | |
| - | | November
| + | |
| - | | 81.2
| + | |
| - | | 27.3
| + | |
| - | | 83.0
| + | |
| - | | 28.3
| + | |
| - | | 83.0
| + | |
| - | | 28.3
| + | |
| - | | 82.6
| + | |
| - | | 28.1
| + | |
| - | | 9
| + | |
| - | | + | |
| - | |-
| + | |
| - | | December
| + | |
| - | | 79.2
| + | |
| - | | 26.2
| + | |
| - | | 81.2
| + | |
| - | | 27.3
| + | |
| - | | 80.0
| + | |
| - | | 26.7
| + | |
| - | | 80.3
| + | |
| - | | 26.8
| + | |
| - | | 8
| + | |
| - | | + | |
| - | |-
| + | |
| - | | Hottest
| + | |
| - | |
| + | |
| - | |
| + | |
| - | | 88.3
| + | |
| - | | 31.3
| + | |
| - | | 94.0
| + | |
| - | | 34.4
| + | |
| - | | 94.0
| + | |
| - | | 34.4
| + | |
| - | |
| + | |
| - | | + | |
| - | |-
| + | |
| - | | Coldest
| + | |
| - | |
| + | |
| - | |
| + | |
| - | | 73.8
| + | |
| - | | 23.1
| + | |
| - | | 68.0
| + | |
| - | | 20.0
| + | |
| - | | 75.0
| + | |
| - | | 23.9
| + | |
| - | |
| + | |
| - | | + | |
| - | |}
| + | |
| - | | + | |
| - | <br>
| + | |
| - | | + | |
| - | Average humidity for 2004 was 74% with the highest monthly average of 78% in
| + | |
| - | August and the lowest of 71% in November.
| + | |
| - | The highest recorded humidity was 89%, and the lowest 59%.<br>
| + | |
| - | One of the consequences of this high humidity is that wet clothes can take
| + | |
| - | longer to dry than you were expecting; pack an extra set of swimming gear!
| + | |
| - | | + | |
| - | ==Rainfall==
| + | |
| - | http://www.gotocayman.com/gcmweath2.gif
| + | |
| - | | + | |
| - | {| border="1" cellpadding="5" cellspacing="0" align="center"
| + | |
| - | |+'''Rainfall'''
| + | |
| - | |-
| + | |
| - | ! | Month
| + | |
| - | ! | Average<br>30-year<br>(inches)
| + | |
| - | ! | Average<br>30-year<br>(mm)
| + | |
| - | ! | Average<br>2002<br>(inches)
| + | |
| - | ! | Average<br>2002<br>(mm)
| + | |
| - | ! | Average<br>2003<br>(inches)
| + | |
| - | | + | |
| - | ! | Average<br>2003<br>(mm)
| + | |
| - | ! | Average<br>2004<br>(inches)
| + | |
| - | ! | Average<br>2004<br>(mm)
| + | |
| - | | + | |
| - | |-
| + | |
| - | | January
| + | |
| - | | 1.96
| + | |
| - | | 49.78
| + | |
| - | | 0.96
| + | |
| - | | 24.38
| + | |
| - | | 11.42
| + | |
| - | | 290.07
| + | |
| - | | 1.0
| + | |
| - | | 24.89
| + | |
| - | | + | |
| - | |-
| + | |
| - | | February
| + | |
| - | | 1.84
| + | |
| - | | 46.74
| + | |
| - | | 0.75
| + | |
| - | | 19.05
| + | |
| - | | 0.34
| + | |
| - | | 8.64
| + | |
| - | | 0.2
| + | |
| - | | 4.32
| + | |
| - | | + | |
| - | |-
| + | |
| - | | March
| + | |
| - | | 1.41
| + | |
| - | | 35.81
| + | |
| - | | 0.69
| + | |
| - | | 17.53
| + | |
| - | | 0.36
| + | |
| - | | 9.14
| + | |
| - | | 2.2
| + | |
| - | | 55.63
| + | |
| - | | + | |
| - | |-
| + | |
| - | | April
| + | |
| - | | 1.68
| + | |
| - | | 42.67
| + | |
| - | | 0.81
| + | |
| - | | 20.57
| + | |
| - | | 0.17
| + | |
| - | | 4.32
| + | |
| - | | 0.0
| + | |
| - | | 0.76
| + | |
| - | | + | |
| - | |-
| + | |
| - | | May
| + | |
| - | | 5.53
| + | |
| - | | 140.46
| + | |
| - | | 16.14
| + | |
| - | | 409.96
| + | |
| - | | 9.18
| + | |
| - | | 233.17
| + | |
| - | | 3.9
| + | |
| - | | 99.06
| + | |
| - | | + | |
| - | |-
| + | |
| - | | June
| + | |
| - | | 5.72
| + | |
| - | | 145.29
| + | |
| - | | 3.09
| + | |
| - | | 78.49
| + | |
| - | | 15.45
| + | |
| - | | 392.43
| + | |
| - | | 1.0
| + | |
| - | | 25.15
| + | |
| - | | + | |
| - | |-
| + | |
| - | | July
| + | |
| - | | 5.81
| + | |
| - | | 147.57
| + | |
| - | | 2.68
| + | |
| - | | 68.07
| + | |
| - | | 4.43
| + | |
| - | | 112.52
| + | |
| - | | 9.1
| + | |
| - | | 230.12
| + | |
| - | | + | |
| - | |-
| + | |
| - | | August
| + | |
| - | | 6.35
| + | |
| - | | 161.29
| + | |
| - | | 8.88
| + | |
| - | | 225.55
| + | |
| - | | 4.34
| + | |
| - | | 110.24
| + | |
| - | | 10.2
| + | |
| - | | 259.84
| + | |
| - | | + | |
| - | |-
| + | |
| - | | September
| + | |
| - | | 8.04
| + | |
| - | | 204.22
| + | |
| - | | 18.72
| + | |
| - | | 475.49
| + | |
| - | | 12.15
| + | |
| - | | 308.61
| + | |
| - | | 20.6
| + | |
| - | | 522.22
| + | |
| - | | + | |
| - | |-
| + | |
| - | | October
| + | |
| - | | 8.55
| + | |
| - | | 217.17
| + | |
| - | | 4.44
| + | |
| - | | 112.78
| + | |
| - | | 10.92
| + | |
| - | | 277.37
| + | |
| - | | 2.5
| + | |
| - | | 63.25
| + | |
| - | | + | |
| - | |-
| + | |
| - | | November
| + | |
| - | | 6.63
| + | |
| - | | 168.40
| + | |
| - | | 4.32
| + | |
| - | | 109.73
| + | |
| - | | 1.98
| + | |
| - | | 50.29
| + | |
| - | | 1.1
| + | |
| - | | 26.92
| + | |
| - | | + | |
| - | |-
| + | |
| - | | December
| + | |
| - | | 2.95
| + | |
| - | | 74.93
| + | |
| - | | 3.99
| + | |
| - | | 101.35
| + | |
| - | | 1.88
| + | |
| - | | 47.75
| + | |
| - | | 0.3
| + | |
| - | | 6.60
| + | |
| - | | + | |
| - | |-
| + | |
| - | | Most rain in 24 hours
| + | |
| - | |
| + | |
| - | |
| + | |
| - | | 6.87
| + | |
| - | | 174.50
| + | |
| - | | 9.45
| + | |
| - | | 240.03
| + | |
| - | | 3.5
| + | |
| - | | 88.90
| + | |
| - | | + | |
| - | |}
| + | |
| - | | + | |
| - | | + | |
| - | During 2004, the most rainfall in a 24 hour period was 3.50 inches (88.9m) on 21st August,
| + | |
| - | but 12.14 inches (273.64mm) fell in a 36 hour period during Hurricane Ivan on
| + | |
| - | 12/13th Septembe. In 2004, there were 220 days free of rain, and rain
| + | |
| - | was recorded on 142 days. There were 54 days on which thunder occurred.<br>
| + | |
| - | The average barometric pressure was 29.98 inches (1015.2 mb). The
| + | |
| - | highest reading of 30.23 inches (1023.7Mb) on 12th January 2004. The lowest
| + | |
| - | pressure recorded during Hurricane Ivan was 29.67 inches (970mb). Average wind
| + | |
| - | speed for the year was 10 knotts from the East.
| + | |
| - | | + | |
| - | Peak tourist season is mid-December to May.
| + | |
| - | | + | |
| - | The rainy season runs from mid-May to November. It is not uncommon for it to
| + | |
| - | be raining at one end of the island, but have brilliant sunshine elsewhere, so
| + | |
| - | it can be worth going for a drive to see another part of the island and find
| + | |
| - | the sun. Usually when it rains, it rains heavily for a couple of hours and
| + | |
| - | then stays clear for the rest of the day. However, if a tropical depression
| + | |
| - | settles over the island, it can rain for days on end, with flooding causing
| + | |
| - | severe problems.
| + | |
| - | | + | |
| - | ==Hurricanes==
| + | |
| - | The hurricane season runs from June to November -
| + | |
| - | it tends to be the hurricanes that start in the Caribbean waters
| + | |
| - | (at the end of the season) as opposed to those that develop of
| + | |
| - | Africa (earlier in the hurricane season) that cause most damage to
| + | |
| - | the islands. The most recent brushes with hurricanes, were Hurricane Ivan
| + | |
| - | which hit in September 2004 and
| + | |
| - | caused damage estimated at CI$2.8 billion - see the news reports for
| + | |
| - | [[News2004#September_2004_-_Hurricane_Ivan|News from Cayman - September 2004]] onwards.
| + | |
| - | The islands were also hit by Hurricane Gilbert in September 1988, which
| + | |
| - | passed 30 miles south of Grand Cayman, and Hurricane Mitch in
| + | |
| - | October/November 1998 passing about 200 miles to the south.
| + | |
| - | | + | |
| - | Hurricane Michelle
| + | |
| - | in November 2001 caused considerable damage on the south and west sides from
| + | |
| - | South Sound all the way round to Northwest Point. (See [[News2001#November_2001|
| + | |
| - | News from Cayman - November 2001]] for more details.)
| + | |
| - | | + | |
| - | However, a couple of tropical storms have also caused damage in Cayman in recent years.
| + | |
| - | | + | |
| - | During the 2003 storm season,
| + | |
| - | only one storm, Tropical Storm Claudette, moved through the northwest Caribbean.
| + | |
| - | Claudette passed 160 miles southwest of Grand Cayman on 10th July. The storm
| + | |
| - | produced cloudy skies, fresh winds and rough seas on 10-11 July and 2.89 inches
| + | |
| - | of rainfall was recorded.
| + | |
| - | | + | |
| - | Even though the hurricane season was fairly uneventful, the Cayman Islands did
| + | |
| - | experience some severe weather events in 2003. Heavy rain caused major
| + | |
| - | flooding on 19 January and 27 June in Grand Cayman. The very high rainfall
| + | |
| - | total in January was particularly unusual and included the highest 24-hour
| + | |
| - | total since records commenced in 1957. This single 24-hour total on January
| + | |
| - | 18th also exceeded any previous January total on record. Flooding in both
| + | |
| - | cases was localized to southwestern Grand Cayman.
| + | |
| - | | + | |
| - | During the 2002 storm season,
| + | |
| - | Tropical Storm Isidore passed 9 miles north of Cayman Brac, 12:00am on 19th
| + | |
| - | September. Peak wind speed was recorded at 61 knots or 67 mph in the Brac.
| + | |
| - | Rainfall accumulation of 21.74 inches was recorded between 7:00pm on 18th
| + | |
| - | September and 6:00pm on 19 September in Cayman Brac and 13.10 inches were
| + | |
| - | recorded in Grand Cayman 17-21 September. The storm knocked down a few light
| + | |
| - | poles and caused minor damage to buildings with total damages estimated at
| + | |
| - | $30,000-$35,000. Isidore became a hurricane north of the Cayman Islands,
| + | |
| - | eventually becoming a category III hurricane in the Gulf of Mexico.
| + | |
| - | | + | |
| - | Tropical Storm Lili passed 4 miles north of Cayman Brac 9:00am 30th September.
| + | |
| - | In the Brac a peak wind speed of 51 knots or 57 mph and rainfall of 3.91 inches
| + | |
| - | were recorded between 7:00pm 29th September and 7:00pm the following day.
| + | |
| - | Locals also reported a few twisters. Damage costs for this system were
| + | |
| - | estimated between $312,500 and $500,000, mostly in the Sister Islands.
| + | |
| - | Lili became a hurricane northwest of Cayman Brac and eventually became a
| + | |
| - | category IV hurricane in the Gulf of Mexico.
| + | |
| - |
| + | |
| - | | + | |
| - | For links to weather sites/hurricane tracking information please see the [[Weather|Weather Resources page]]
| + | |